

Question: Mr. Shrager does not always let his statistics class out on time. In fact, he seems to end class according to his own internal clock.
Mr. Shrager does not always let his statistics class out on time. In fact, he seems to end class according to his own “internal clock.” The density curve here models the distribution of Y, the amount of time after class ends (in minutes) when Mr. Shrager dismisses the class on a randomly selected day. (A negative value indicates he ended class early.)
a. Find and interpret P(−1 ≤ Y ≤ 1).
b. What is μY ? Explain your answer.
c. Find the value of k that makes this statement true: P(Y ≥ k) = 0.25.
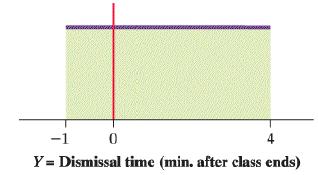
-1 4 Y = Dismissal time (min. after class ends)
Step by Step Solution
3.31 Rating (172 Votes )
There are 3 Steps involved in it
Y The amount of time after class ends in minutes we are given that y is ... View full answer

Get step-by-step solutions from verified subject matter experts
Document Format (2 attachments)
2048_61d6ac3430f85_837201.pdf
180 KBs PDF File
2048_61d6ac3430f85_837201.docx
120 KBs Word File