

Refer to Exercise 76. a. Use your calculator to make a Normal probability plot of the data.
Question:
Refer to Exercise 76.
a. Use your calculator to make a Normal probability plot of the data. Sketch this graph on your paper.
b. What does the graph in part (a) imply about whether the distribution of shark length is approximately Normal? Explain.
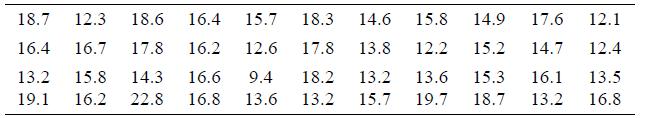
Exercise 76.
Here are the lengths (in feet) of 44 great white sharks:
Fantastic news! We've Found the answer you've been seeking!
Step by Step Answer:

Answered By
Rohail Amjad
Experienced Finance Guru have a full grip on various sectors, i.e Media, Insurance, Automobile, Rice and other Financial Services.
Have also served in Business Development Department as a Data Anlayst
32+ Reviews
83+ Question Solved
Related Book For 

Question Posted:
