

Some skeptical AP Statistics students want to investigate the newspapers claim in Exercise 11, so they choose
Question:
Some skeptical AP® Statistics students want to investigate the newspaper’s claim in Exercise 11, so they choose an SRS of 100 students from the school to interview.
In their sample, 45 students completed their homework last week. Does this provide convincing evidence that less than 60% of all students at the school completed their assigned homework last week?
a. What is the evidence that less than 60% of all students completed their assigned homework last week?
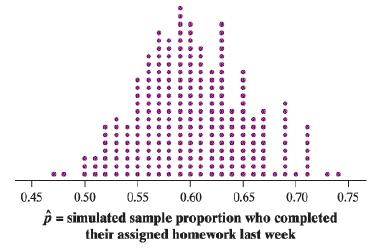
b. Provide two explanations for the evidence described in part (a). We used technology to simulate choosing 250 SRSs of size n = 100 from a population of 2000 students where 60% completed their assigned homework last week. The dotplot shows p̂ = the sample proportion of students who completed their assigned homework last week for each of the 250 simulated samples.
c. There is one dot on the graph at 0.73. Explain what this value represents.
d. Would it be surprising to get a sample proportion of p̂ = 0.45 or smaller in an SRS of size 100 when p = 0.60? Justify your answer.
e. Based on your previous answers, is there convincing evidence that less than 60% of all students at the school completed their assigned homework last week? Explain your reasoning.
Step by Step Answer:
a prob actual numbersample size 45100 045 45 which is less than 60 b ...View the full answer


