

The bar graph displays data on the percent of smartphone owners in several age groups who say
Question:
The bar graph displays data on the percent of smartphone owners in several age groups who say that they use their phone for turn-by-turn navigation.
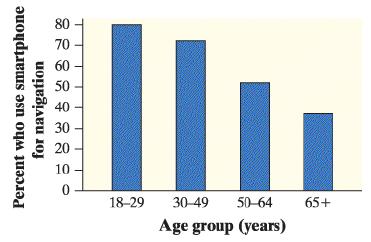
a. Describe what the graph reveals about the relationship between age group and use of smartphones for navigation.
b. Would it be appropriate to make a pie chart of the data? Explain.
Fantastic news! We've Found the answer you've been seeking!
Step by Step Answer:
a 80 people in 1829 age group 70 people in 3049 age group 5...View the full answer

Answered By
Manish kumar
Hello everyone! My name is ManishKumar, and I am thrilled to be your teacher I wanted to take a moment to introduce myself and share a little bit about my background.
I have always been passionate about education and helping students reach their full potential. I have 5 years of experience in teaching and have had the privilege of working with diverse groups of students throughout my career.
I hold a [Bachelor's/Master's/Ph.D.] degree in from Himachal PradeshUniversity, where I gained a deep understanding of the subject and developed effective teaching strategies. I believe that education is a lifelong journey, and I continue to expand my knowledge and skills through professional development programs and staying up to date with the latest educational research and practices.
In my classroom, I strive to create a positive and inclusive learning environment where every student feels valued and supported. I believe in fostering a collaborative and engaging atmosphere, encouraging active participation, critical thinking, and creativity.
Apart from teaching, I have a passion for music . I believe that these personal interests help me bring a unique perspective to the classroom and connect with students on a deeper level.
I am excited to embark on this learning journey with all of you and look forward to getting to know each and every one of you. Please feel free to reach out to me if you have any questions, concerns, or if you simply want to chat. Let's make this a memorable and successful journey together!
0 Reviews
10+ Question Solved
Related Book For 

Question Posted:
