

Question: The following scatterplot plots the average brain weight (in grams) versus average body weight (in kilograms) for 96 species of mammals. There are many small
The following scatterplot plots the average brain weight (in grams) versus average body weight (in kilograms) for 96 species of mammals. There are many small mammals whose points overlap at the lower left.
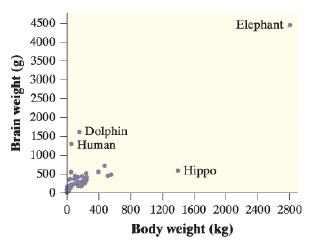
a. The correlation between body weight and brain weight is r = 0.86. Interpret this value.
b. What effect does the human have on the correlation? Justify your answer.
4500 Elephant 4000 3500 3000 2500 2000 Dolphin Human 1500 1000 Hippo 500 400 800 1200 1600 2000 2400 2800 Body weight (kg) Brain weight
Step by Step Solution
3.50 Rating (163 Votes )
There are 3 Steps involved in it
a The correlation between body weight and brain weight i... View full answer

Get step-by-step solutions from verified subject matter experts