

Question: The following scatterplot shows the calories and salt content (measured in milligrams of sodium) in 17 brands of meat hot dogs. a. The correlation for
The following scatterplot shows the calories and salt content (measured in milligrams of sodium) in 17 brands of meat hot dogs.
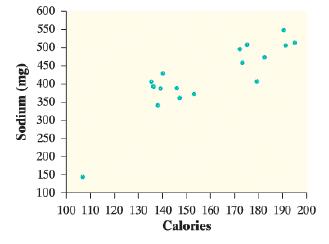
a. The correlation for these data is r = 0.87. Interpret this value.
b. What effect does the hot dog brand with the smallest calorie content have on the correlation? Justify your answer.
600 550 500 450 400 350 - 300 250 200 150 100 100 110 120 130 140 150 160 170 180 190 200 Calories (Bu) unipos
Step by Step Solution
3.48 Rating (158 Votes )
There are 3 Steps involved in it
a A high positive correlation value of 087 suggests that the calories and salt content in br... View full answer

Get step-by-step solutions from verified subject matter experts