

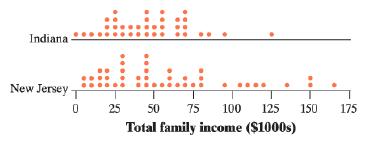
The parallel dotplots show the total family income of randomly chosen individuals from Indiana (38 individuals) and
Question:
The parallel dotplots show the total family income of randomly chosen individuals from Indiana (38 individuals) and New Jersey (44 individuals). Compare the distributions of total family incomes in these two samples.
Fantastic news! We've Found the answer you've been seeking!
Step by Step Answer:

Related Book For 

Question Posted:
