

Question: The scatterplot shows the relationship between the amount of fat (in grams) and number of calories in products sold at Starbucks. Describe the relationship between
The scatterplot shows the relationship between the amount of fat (in grams) and number of calories in products sold at Starbucks. Describe the relationship between fat and calories for these products.
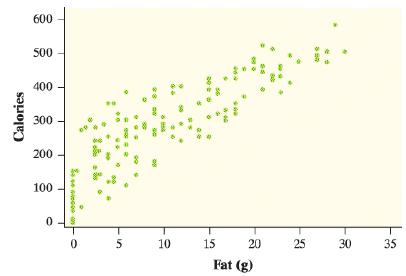
600 500 400 300 200 100 5 10 15 20 25 30 35 Fat (g) Calories a se eco
Step by Step Solution
★★★★★
3.51 Rating (175 Votes )
There are 3 Steps involved in it
1 Expert Approved Answer
Step: 1 Unlock

From the scatterplot it is observed that there ... View full answer
Question Has Been Solved by an Expert!
Get step-by-step solutions from verified subject matter experts
Step: 2 Unlock
Step: 3 Unlock
Document Format (2 attachments)
2048_61d6ac342c3ee_836723.pdf
180 KBs PDF File
2048_61d6ac342c3ee_836723.docx
120 KBs Word File