Question:
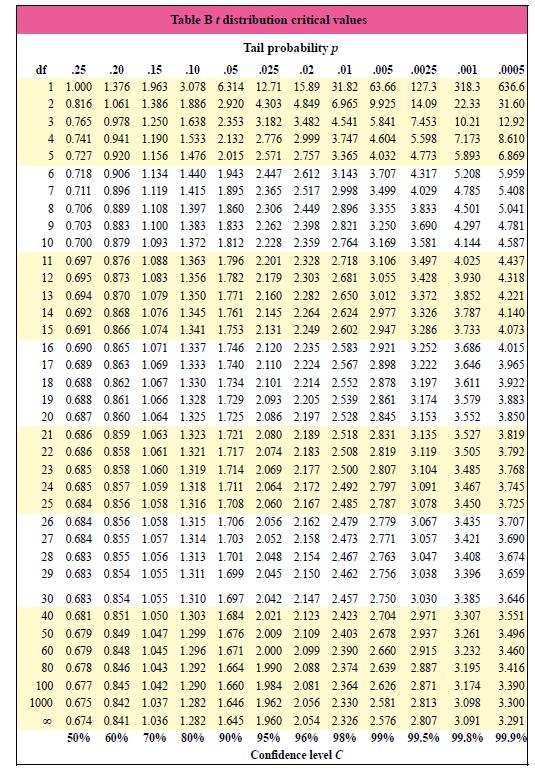
What critical value t* from Table B should be used for a confidence interval for the population mean in each of the following situations?
a. A 90% confidence interval based on n = 12 randomly selected observations
b. A 95% confidence interval from an SRS of 30 observations
c. A 99% confidence interval based on a random sample of size 58
Table B.
Transcribed Image Text:
Table Bt distribution critical values Tail probability p df .25 .20 .15 .10 .05 025 .02 .01 .005 .0025 .001 .0005 1 1.000 1.376 1.963 3.078 6.314 12.71 15.89 31.82 63.66 2 0.816 3 0.765 0.978 1.250 1.638 2.353 3.182 3.482 4.541 5.841 127.3 318.3 636.6 1.061 1.386 1.886 2.920 4.303 4.849 6.965 9.925 14.09 22.33 31.60 7.453 10.21 12.92 4 0.741 0.941 1.190 1.533 2.132 2.776 2.999 3.747 4.604 5.598 7.173 8.610 5 0.727 0.920 1.156 1.476 2.015 2.571 2.757 3.365 4.032 6 0.718 0.906 1.134 1.440 1.943 2.447 2.612 3.143 3.707 4.317 7 0.711 8 0.706 9 0.703 0.883 1.100 1.383 1.833 2.262 2.398 2.821 3.250 3.690 4.773 5.893 6.869 5.208 5.959 0.896 1.119 1.415 1.895 2.365 2.517 2.998 3.499 4.029 4.785 5.408 0.889 1.108 1.397 1.860 2.306 2.449 2.896 3.355 3.833 4.501 5.041 4.297 4.781 10 0.700 0.879 1.093 1.372 1.812 2.228 2.359 2.764 3.169 3.581 4.144 4.587 11 0.697 0.876 1.088 1.363 1.796 2.201 2.328 2.718 3.106 3.497 4.025 4.437 12 0.695 0.873 1.083 1.356 1.782 2.179 2.303 2.681 3.055 3.428 3.930 4.318 13 0.694 0.870 1.079 1.350 1.771 2.160 2.282 2.650 3.012 3.372 3.852 4.221 14 0.692 0.868 1.076 1.345 1.761 2.145 2.264 2.624 2.977 3.326 3.787 4.140 15 0.691 0.866 1.074 1.341 1.753 2.131 2.249 2.602 2.947 3.286 3.733 4.073 16 0.690 0.865 1.071 1.337 1.746 2.120 2.235 2.583 2.921 3.252 3.686 4.015 17 0.689 0.863 1.069 1.333 1.740 2.110 2.224 2.567 2.898 3.222 3.646 3.965 18 0.688 0.862 1.067 1.330 1.734 2.101 2.214 2.552 2.878 3.197 3.611 3.922 19 0.688 0.861 1.066 1.328 1.729 2.093 2.205 2.539 2.861 3.174 3.579 3.883 20 0.687 0.860 1.064 1.325 1.725 2.086 2.197 2.528 2.845 3.153 3.552 3.850 21 0.686 0.859 1.063 1.323 1.721 2.080 2.189 2.518 2.831 3.135 3.527 3.819 22 0.686 0.858 1.061 1.321 1.717 2.074 2.183 2.508 2.819 3.119 3.505 3.792 23 0.685 0.858 1.060 1.319 1.714 2.069 2.177 2.500 2.807 3.104 3.485 3.768 24 0.685 0.857 1.059 1.318 1.711 2.064 2.172 2.492 2.797 3.091 3.467 3.745 25 0.684 0.856 1.058 1.316 1.708 2.060 2.167 2.485 2.787 3.078 3.450 3.725 26 0.684 0.856 1.058 1.315 1.706 2.056 2.162 2.479 2.779 3.067 3.435 3.707 27 0.684 0.855 1.057 1.314 1.703 2.052 2.158 2.473 2.771 3.057 3.421 3.690 28 0.683 0.855 1.056 1.313 1.701 2.048 2.154 2.467 2.763 3.047 3.408 3.674 29 0.683 0.854 1.055 1.311 1.699 2.045 2.150 2.462 2.756 3.038 3.396 3.659 30 0.683 0.854 1.055 1.310 1.697 2.042 2.147 2.457 2.750 3.030 3.385 3.646 40 0.681 0.851 1.050 1.303 1.684 2.021 2.123 2.423 2.704 2.971 3.307 3.551 50 0.679 0.849 1.047 1.299 1.676 2.009 2.109 2.403 2.678 2.937 3.261 3.496 60 0.679 0.848 1.045 1.296 1.671 2.000 2.099 2.390 2.660 2.915 3.232 3.460 80 0.678 0.846 1.043 1.292 1.664 1.990 2.088 2.374 2.639 2.887 3.195 3.416 100 0.677 0.845 1.042 1.290 1.660 1.984 2.081 2.364 2.626 2.871 3.174 3.390 1000 0.675 0.842 1.037 1.282 1.646 1.962 2.056 2.330 2.581 2.813 3.098 3.300 0.674 0.841 1.036 1.282 1.645 1.960 2.054 2.326 2.576 2.807 3.091 3.291 00 50% 60% 70% 80% 90% 95% 96% 98% 99% 99.5% 99.8% 99.9% Confidence level C


