

Question: Draw a best-fit line for the plotted data. 120 100 80 60 40 20. 0 0 2 4 6 8 10 12 X
Draw a best-fit line for the plotted data.
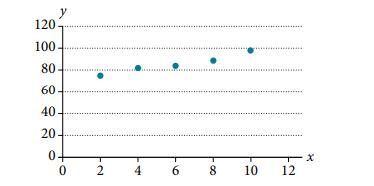
120 100 80 60 40 20. 0 0 2 4 6 8 10 12 X
Step by Step Solution
★★★★★
3.46 Rating (162 Votes )
There are 3 Steps involved in it
1 Expert Approved Answer
Step: 1 Unlock

from the graph for the best line equat... View full answer
Question Has Been Solved by an Expert!
Get step-by-step solutions from verified subject matter experts
Step: 2 Unlock
Step: 3 Unlock