

Question: Draw a scatter plot for the data in Table 3. If we wanted to know when the population would reach 15,000, would the answer involve
Draw a scatter plot for the data in Table 3. If we wanted to know when the population would reach 15,000, would the answer involve interpolation or extrapolation?
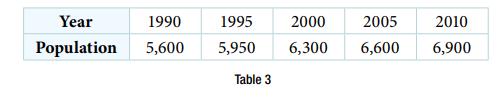
Year 1990 Population 5,600 1995 2000 2005 5,950 6,300 6,600 Table 3 2010 6,900
Step by Step Solution
★★★★★
3.50 Rating (163 Votes )
There are 3 Steps involved in it
1 Expert Approved Answer
Step: 1 Unlock

yes the ... View full answer
Question Has Been Solved by an Expert!
Get step-by-step solutions from verified subject matter experts
Step: 2 Unlock
Step: 3 Unlock