

Question: Enter the data from Table 2 into a graphing calculator and graph the resulting scatter plot. Determine whether the data from the table would likely
Enter the data from Table 2 into a graphing calculator and graph the resulting scatter plot. Determine whether the data from the table would likely represent a function that is linear, exponential, or logarithmic.
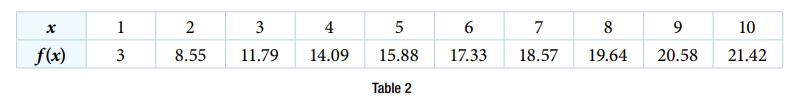
x 1 f(x) 3 2 8.55 3 11.79 4 14.09 5 15.88 Table 2 6 17.33 7 8 9 18.57 19.64 20.58 10 21.42
Step by Step Solution
★★★★★
3.48 Rating (161 Votes )
There are 3 Steps involved in it
1 Expert Approved Answer
Step: 1 Unlock

from the table 1... View full answer
Question Has Been Solved by an Expert!
Get step-by-step solutions from verified subject matter experts
Step: 2 Unlock
Step: 3 Unlock