

Question: For the following exercises, enter the data from each table into a graphing calculator and graph the resulting scatter plots. Determine whether the data from
For the following exercises, enter the data from each table into a graphing calculator and graph the resulting scatter plots. Determine whether the data from the table could represent a function that is linear, exponential, or logarithmic.
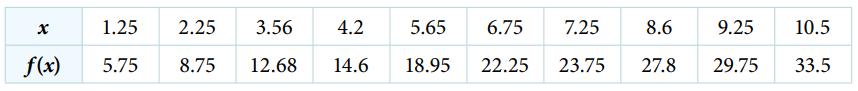
x f(x) 1.25 2.25 5.75 8.75 3.56 4.2 5.65 6.75 7.25 12.68 14.6 18.95 22.25 23.75 8.6 9.25 10.5 27.8 29.75 33.5
Step by Step Solution
★★★★★
3.49 Rating (149 Votes )
There are 3 Steps involved in it
1 Expert Approved Answer
Step: 1 Unlock

To graph the scatter plot using Python you can use t... View full answer
Question Has Been Solved by an Expert!
Get step-by-step solutions from verified subject matter experts
Step: 2 Unlock
Step: 3 Unlock