

Question: For the following exercises, enter the data from each table into a graphing calculator and graph the resulting scatter plots. Determine whether the data from
For the following exercises, enter the data from each table into a graphing calculator and graph the resulting scatter plots. Determine whether the data from the table could represent a function that is linear, exponential, or logarithmic.
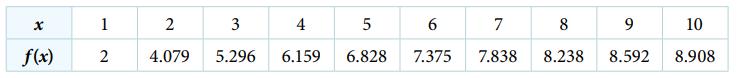
X f(x) 1 2 2 4.079 3 5.296 4 6.159 5 6.828 6 7.375 7 8 7.838 8.238 9 8.592 10 8.908
Step by Step Solution
★★★★★
3.34 Rating (166 Votes )
There are 3 Steps involved in it
1 Expert Approved Answer
Step: 1 Unlock

The data from th... View full answer
Question Has Been Solved by an Expert!
Get step-by-step solutions from verified subject matter experts
Step: 2 Unlock
Step: 3 Unlock