

Question: Consider these two data sets: One data set follows a linear pattern, and one data set follows a quadratic relation. (a) Draw a scatter plot
Consider these two data sets: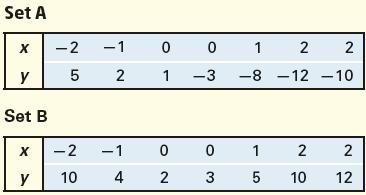
One data set follows a linear pattern, and one data set follows a quadratic relation.
(a) Draw a scatter plot of each data set. Determine which is linear and which is quadratic. For the linear data, indicate whether the relation shows a positive or a negative slope. For the quadratic relation, indicate whether the quadratic function of best fit will be concave up or concave down.
(b) For the linear data set, find the line of best fit.
(c) For the quadratic data set, find the quadratic function of best fit.
Set A X y Set B X -2 5 -2 10 -1 0 0 2 1 -3 -1 4 0 2 1 2 2 -8 -12 -10 0 1 3 5 2 10 2 12
Step by Step Solution
3.31 Rating (160 Votes )
There are 3 Steps involved in it

Get step-by-step solutions from verified subject matter experts