

Graphs of the position functions of two particles are shown, where t is measured in seconds. When
Question:
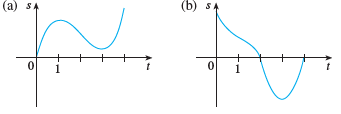
Graphs of the position functions of two particles are shown, where t is measured in seconds. When is each particle speeding up? When is it slowing down? Explain.
Fantastic news! We've Found the answer you've been seeking!
Step by Step Answer:
a The velocity v is positive when s is increasing that is on the intervals 0 1 an...View the full answer

Answered By
Mercy Kangai
I provide creative and detailed administrative, web search, academic writing, data entry, Personal assistant, Content writing, Translation, Academic writing, editing and proofreading services. I excel at working under tight deadlines with strict expectations. I possess the self-discipline and time management skills necessary to have served as an academic writer for the past seven years. I can bring value to your business and help solve your administrative assistant issues. I have extensive experience in marketing and small business management.
27+ Reviews
82+ Question Solved
Related Book For 

Question Posted:
