

Shown are graphs of the position functions of two runners, A and B, who run a 100-meter
Question:
Shown are graphs of the position functions of two runners, A and B, who run a 100-meter race and finish in a tie.
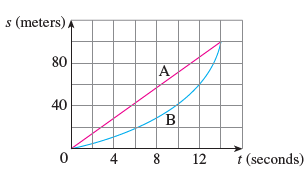
(a) Describe and compare how the runners run the race.
(b) At what time is the distance between the runners the greatest?
(c) At what time do they have the same velocity?
Fantastic news! We've Found the answer you've been seeking!
Step by Step Answer:
a Runner A runs the entire 100meter race at the same velocity since the slo...View the full answer

Answered By
Utsab mitra
I have the expertise to deliver these subjects to college and higher-level students. The services would involve only solving assignments, homework help, and others.
I have experience in delivering these subjects for the last 6 years on a freelancing basis in different companies around the globe. I am CMA certified and CGMA UK. I have professional experience of 18 years in the industry involved in the manufacturing company and IT implementation experience of over 12 years.
I have delivered this help to students effortlessly, which is essential to give the students a good grade in their studies.
2+ Reviews
10+ Question Solved
Related Book For 

Question Posted:
