

Question: Shown is a graph of the global average temperature T during the 20th century. Estimate the following. (a) The global average temperature in 1950 (b)
(a) The global average temperature in 1950
(b) The year when the average temperature was 14.2°C
(c) The year when the temperature was smallest? Largest?
(d) The range of T
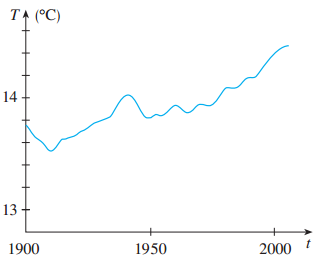
TA (C) 14 13 1900 1950 2000
Step by Step Solution
★★★★★
3.38 Rating (157 Votes )
There are 3 Steps involved in it
1 Expert Approved Answer
Step: 1 Unlock

a When t 1950 T 138C so the global average temperature in 1950 was about 1... View full answer
Question Has Been Solved by an Expert!
Get step-by-step solutions from verified subject matter experts
Step: 2 Unlock
Step: 3 Unlock