

The data below represent the expected percentage of putts that will be made by professional golfers on
Question:
The data below represent the expected percentage of putts that will be made by professional golfers on the PGA Tour, depending on distance. For example, it is expected that 99.3% of 2-foot putts will be made.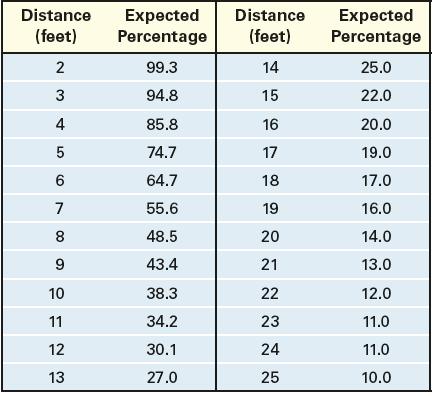
(a) Using a graphing utility, draw a scatter plot of the data with distance as the independent variable.
(b) Based on the scatter plot drawn in part (a), decide on a model (linear, quadratic, cubic, exponential, logarithmic, or logistic) that you think best describes the relation between distance and expected percentage. Be sure to justify your choice of model.
(c) Using a graphing utility, find the model of best fit.
(d) Graph the function found in part (c) on the scatter plot.
(e) Use the function found in part (c) to predict what percentage of 30-foot putts will be made.
Step by Step Answer:

This question has not been answered yet.
You can Ask your question!


Precalculus Concepts Through Functions A Unit Circle Approach To Trigonometry
ISBN: 9780137945139
5th Edition
Authors: Michael Sullivan
