

Question: The data below represent world population. An ecologist is interested in building a model that describes the world population. (a) Using a graphing utility, draw
The data below represent world population. An ecologist is interested in building a model that describes the world population.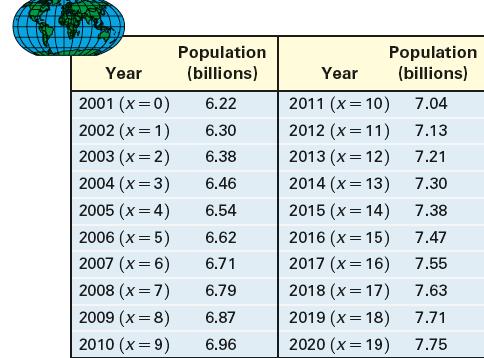
(a) Using a graphing utility, draw a scatter plot of the data using years since 2001 as the independent variable and population as the dependent variable.
(b) Using a graphing utility, build a logistic model from the data.
(c) Using a graphing utility, graph the function found in part (b) on the scatter plot.
(d) Based on the function found in part (b), what is the carrying capacity of the world?
(e) Use the function found in part (b) to predict the population of the world in 2025.
(f) When will world population be 9 billion?
Year 2001 (X=0) 2002 (x = 1) 2003 (x=2) 2004 (x=3) 2005 (x = 4) 2006 (x=5) 2007 (x = 6) 2008 (X= 7) 2009 (x=8) 2010 (x = 9) Population (billions) 6.22 6.30 6.38 6.46 6.54 6.62 6.71 6.79 6.87 6.96 Population (billions) 7.04 7.13 7.21 7.30 7.38 7.47 7.55 7.63 7.71 7.75 Year 2011 (x = 10) 2012 (x=11) 2013 (x=12) 2014 (x = 13) 2015 (x = 14) 2016 (x = 15) 2017 (x = 16) 2018 (x = 17) 2019 (x = 18) 2020 (x = 19)
Step by Step Solution
3.41 Rating (151 Votes )
There are 3 Steps involved in it

Get step-by-step solutions from verified subject matter experts