

Question: The data on the shown below represent the percentage of families with children in the United States whose income is below the poverty level. (a)
The data on the shown below represent the percentage of families with children in the United States whose income is below the poverty level.
(a) With a graphing utility, draw a scatter plot of the data. Comment on the type of relation that appears to exist between the two variables.
(b) Decide on a function of best fit to these data (linear, quadratic, or cubic), and use this function to predict the percentage of U.S. families with children that were below the poverty level in 2021 (t = 16).
(c) Draw the function of best fit on the scatter plot drawn in part (a).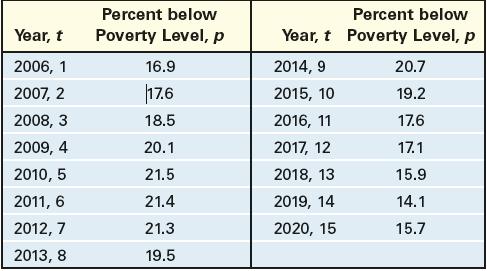
Year, t 2006, 1 2007, 2 2008, 3 2009, 4 2010, 5 2011, 6 2012, 7 2013, 8 Percent below Poverty Level, p 16.9 17.6 18.5 20.1 21.5 21.4 21.3 19.5 Year, t 2014, 9 2015, 10 2016, 11 2017, 12 2018, 13 2019, 14 2020, 15 Percent below Poverty Level, p 20.7 19.2 17.6 17.1 15.9 14.1 15.7
Step by Step Solution
3.50 Rating (163 Votes )
There are 3 Steps involved in it

Get step-by-step solutions from verified subject matter experts