

Question: The following data represent the temperature T (Fahrenheit) in Kansas City, Missouri, x hours after midnight on March 18, 2018. (a) Draw a scatter plot
The following data represent the temperature T (°Fahrenheit) in Kansas City, Missouri, x hours after midnight on March 18, 2018.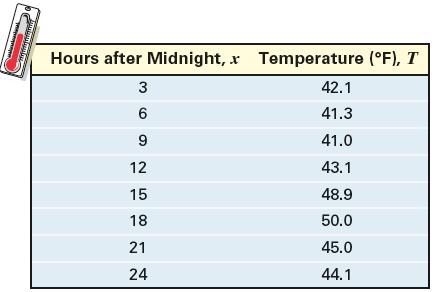
(a) Draw a scatter plot of the data. Comment on the type of relation that may exist between the two variables.
(b) Find the average rate of change in temperature from 9 am to 12 noon.
(c) What is the average rate of change in temperature from 3 pm to 9 pm?
(d) Decide on a function of best fit to these data (linear, quadratic, or cubic) and use this function to predict the temperature at 5 pm.
(e) With a graphing utility, draw a scatter plot of the data and then graph the function of best fit on the scatter plot.
(f) Interpret the y-intercept.
www www the aut Hours after Midnight, x Temperature (F), T 3 6 9 12 15 18 21 24 42.1 41.3 41.0 43.1 48.9 50.0 45.0 44.1
Step by Step Solution
3.50 Rating (167 Votes )
There are 3 Steps involved in it

Get step-by-step solutions from verified subject matter experts