

Question: The following data represent the average monthly temperatures for Indianapolis, Indiana. (a) Draw a scatter plot of the data for one period. (b) Find a
The following data represent the average monthly temperatures for Indianapolis, Indiana.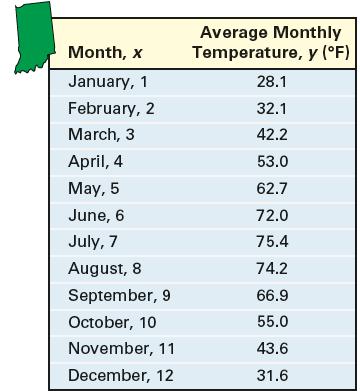
(a) Draw a scatter plot of the data for one period.
(b) Find a sinusoidal function of the form![]()
that models the data.
(c) Draw the sinusoidal function found in part (b) on the scatter plot.
(d) Use a graphing utility to find the sinusoidal function of best fit.
(e) Graph the sinusoidal function of best fit on a scatter plot of the data.
Month, x January, 1 February, 2 March, 3 April, 4 May, 5 June, 6 July, 7 August, 8 September, 9 October, 10 November, 11 December, 12 Average Monthly Temperature, y (F) 28.1 32.1 42.2 53.0 62.7 72.0 75.4 74.2 66.9 55.0 43.6 31.6
Step by Step Solution
3.40 Rating (163 Votes )
There are 3 Steps involved in it

Get step-by-step solutions from verified subject matter experts