

Question: The given data represent the average monthly temperatures for Phoenix, Arizona. (a) Draw a scatter plot of the data for one period. (b) Find a
The given data represent the average monthly temperatures for Phoenix, Arizona.
(a) Draw a scatter plot of the data for one period.
(b) Find a sinusoidal function of the form y = A sin(ωx − ϕ) + B that models the data.
(c) Draw the sinusoidal function found in part (b) on the scatter plot.
(d) Use a graphing utility to find the sinusoidal function of best fit.
(e) Graph the sinusoidal function of best fit on the scatter plot.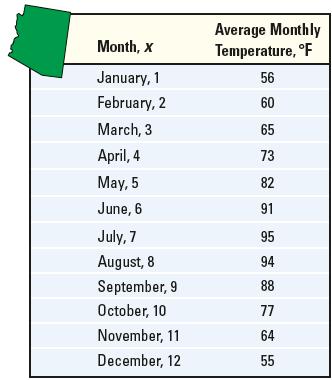
Month, x January, 1 February, 2 March, 3 April, 4 May, 5 June, 6 July, 7 August, 8 September, 9 October, 10 November, 11 December, 12 Average Monthly Temperature, F 56 60 65 73 82 91 95 94 88 77 64 55
Step by Step Solution
3.41 Rating (151 Votes )
There are 3 Steps involved in it

Get step-by-step solutions from verified subject matter experts