

Question: 10) Monthly Temperature The data below represent the average monthly temperatures for Phoenix, Arizona. CUCO'S METRIC GRAPH PAPER Month, m Average Monthly Temperature, T January,
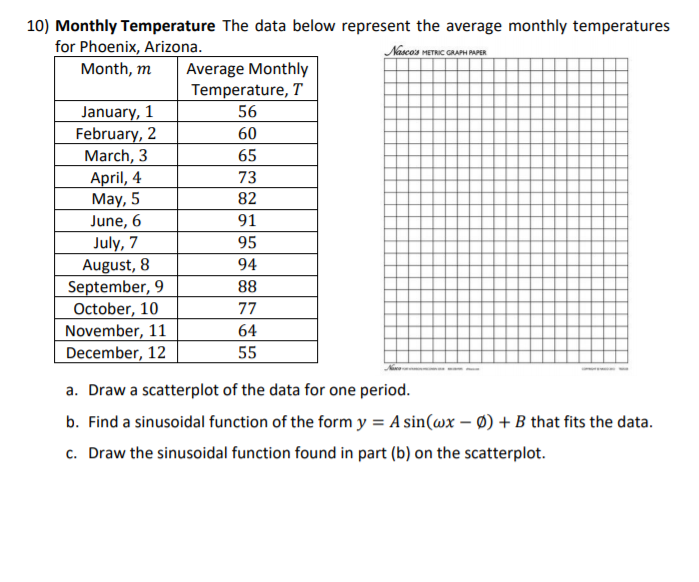
10) Monthly Temperature The data below represent the average monthly temperatures for Phoenix, Arizona. CUCO'S METRIC GRAPH PAPER Month, m Average Monthly Temperature, T January, 1 56 February, 2 60 March, 3 65 April, 4 73 May, 5 82 June, 6 91 July, 7 95 August, 8 94 September, 9 88 October, 10 77 November, 11 64 December, 12 55 a. Draw a scatterplot of the data for one period. b. Find a sinusoidal function of the form y = A sin(wx - () + B that fits the data. c. Draw the sinusoidal function found in part (b) on the scatterplot
Step by Step Solution
There are 3 Steps involved in it
1 Expert Approved Answer
Step: 1 Unlock

Question Has Been Solved by an Expert!
Get step-by-step solutions from verified subject matter experts
Step: 2 Unlock
Step: 3 Unlock