

Question: The normal daily maximum temperatures T (in degrees Fahrenheit) for Chicago, Illinois, are shown in the table. (a) Use a graphing utility to plot the
The normal daily maximum temperatures T (in degrees Fahrenheit) for Chicago, Illinois, are shown in the table.
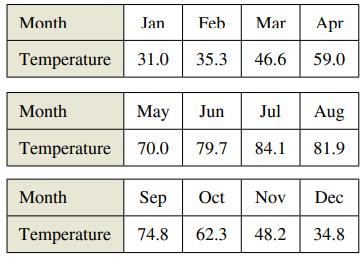
(a) Use a graphing utility to plot the data and find a model for the data of the form T(t) = a + b sin(ct − d) where T is the temperature and t is the time in months, with t = 1 corresponding to January.
(b) Use a graphing utility to graph the model. How well does the model fit the data?
(c) Find T′ and use a graphing utility to graph T′.
(d) Based on the graph of T′, during what times does the temperature change most rapidly? Most slowly? Do your answers agree with your observations of the temperature changes? Explain.
Month Temperature Month Temperature Month Jan 31.0 Feb Mar Apr 35.3 46.6 59.0 May Jun Jul 70.0 79.7 84.1 Sep Oct Nov Temperature 74.8 62.3 48.2 Aug 81.9 Dec 34.8
Step by Step Solution
3.41 Rating (157 Votes )
There are 3 Steps involved in it
a Tt 273 sin049t 190 571 b The model is a good fit c ... View full answer

Get step-by-step solutions from verified subject matter experts