

The size of the total debt owed by the United States federal government continues to grow. In
Question:
The size of the total debt owed by the United States federal government continues to grow. In fact, according to the Department of the Treasury, the debt per person living in the United States is approximately $90,575. The data on the next page represent the U.S. debt for the years 2007–2021. Since the debt D depends on the year y, and each input corresponds to exactly one output, the debt is a function of the year. So D( y) represents the debt for each year y.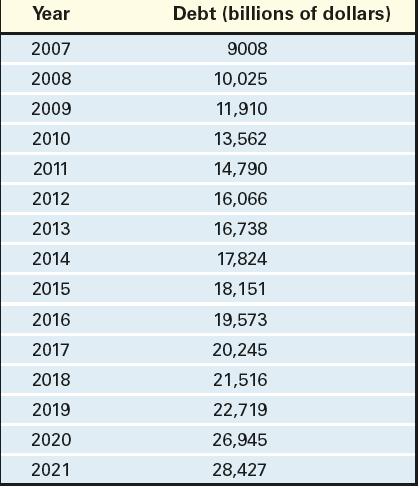
(a) P lot the points ( 2007, 9008), ( 2008, 10 025), and so on.
(b) D raw a line segment from the point ( 2007, 9008) to (2012, 16 066). What does the slope of this line segment represent?
(c) Find the average rate of change of the debt from 2010 to 2012.
(d) Find the average rate of change of the debt from 2013 to 2015.
(e) Find the average rate of change of the debt from 2019 to 2021.
(f) What appears to be happening to the average rate of change as time passes?
Step by Step Answer:


Precalculus Concepts Through Functions A Unit Circle Approach To Trigonometry
ISBN: 9780137945139
5th Edition
Authors: Michael Sullivan
