

The table shows the amount of yeast cells (measured as biomass) growing over a 7-hour period in
Question:
The table shows the amount of yeast cells (measured as biomass) growing over a 7-hour period in a nutrient, as recorded by R. Pearl (1927) during a well-known biological experiment.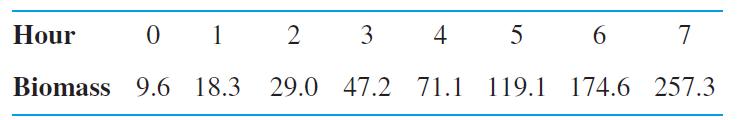
a. Make a scatterplot of the data.
b. Find and plot a regression quadratic, and superimpose the quadratic curve on the scatterplot.
c. What do you estimate as the biomass of yeast in the nutrient after 11 hours?
d. Do you think the quadratic curve would provide a good estimate of the biomass after 18 hours? Give reasons for your answer.
Step by Step Answer:

This question has not been answered yet.
You can Ask your question!
Related Book For 
Thomas Calculus Early Transcendentals
ISBN: 9780321884077
13th Edition
Authors: Joel R Hass, Christopher E Heil, Maurice D Weir
Question Posted:
