

Question: The table shows the average residential and transportation prices for energy consumption in the United States for the years 20002008, as reported by the U.S.
The table shows the average residential and transportation prices for energy consumption in the United States for the years 2000–2008, as reported by the U.S. Department of Energy. The prices are given as dollars paid for one million BTU (British thermal units) of consumption.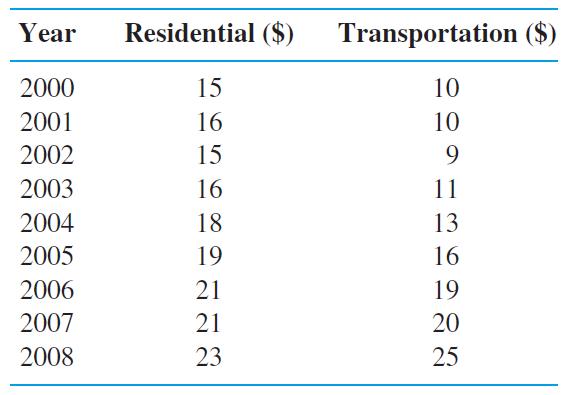
a. Make a scatterplot of the data sets.
b. Find and plot a regression line for each set of data points, and superimpose the lines on their scatterplots.
c. What do you estimate as the average energy price for residential and transportation use for a million BTU in year 2017?
d. In looking at the trend lines, what do you conclude about the rising costs of energy across the two sectors of usage?
Year 2000 2001 2002 2003 2004 2005 2006 2007 2008 Residential ($) Transportation ($) 15 10 16 10 15 9 16 11 18 13 19 16 21 19 21 20 23 25
Step by Step Solution
3.40 Rating (150 Votes )
There are 3 Steps involved in it

Get step-by-step solutions from verified subject matter experts