

The table shows the numbers (in millions) of participants in the free lunch program f and the
Question:
The table shows the numbers (in millions) of participants in the free lunch program f and the reduced price lunch program r in the United States for the years 2007 through 2014.
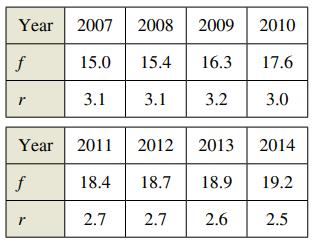
(a) Use the regression capabilities of a graphing utility to find a model of the form r(f) = af3 + bf2 + cf + d for the data, where t is the time in years, with t = 7 corresponding to 2007.
(b) Find dr/dt. Then use the model to estimate dr/dt for t = 9 when it is predicted that the number of participants in the free lunch program will increase at the rate of 1.25 million participants per year.
Fantastic news! We've Found the answer you've been seeking!
Step by Step Answer:
a rf 00096f 3 0559f ...View the full answer

Answered By
Vikash Gupta
I am graduated in Physics in 2018, from KIRORIMAL COLLEGE, University of Delhi. Now I am persuing Master's degree in physics. I like to do physics problems. I have experience of 1 year in tutoring. I think Physics is the only subject where you understand things,how they are happening . In physics you learn Maths and apply it. So I would like to join your platform to solve many Physics problems.
5+ Reviews
10+ Question Solved
Related Book For 

Calculus Of A Single Variable
ISBN: 9781337275361
11th Edition
Authors: Ron Larson, Bruce H. Edwards
Question Posted:
