

Question: Plot Ï 2 Ï versus z for the various cases given in Table 10.7. Assume 10% of the signal power is in the carrier for
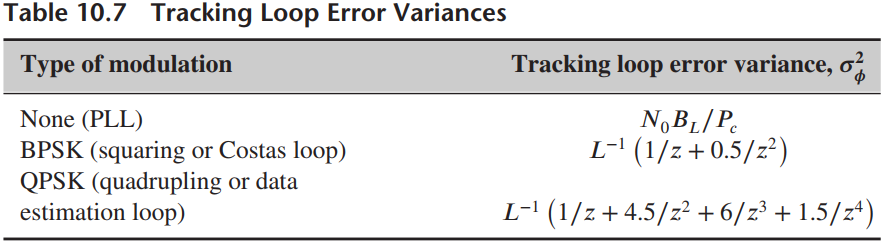
Table 10.7 Tracking Loop Error Variances Tracking loop error variance, o Type of modulation None (PLL) BPSK (squaring or Costas loop) QPSK (quadrupling or data estimation loop) N,BL/P. L-' (1/z+0.5/z) L-' (1/z + 4.5/z? +6/z + 1.5/z*)
Step by Step Solution
★★★★★
3.27 Rating (168 Votes )
There are 3 Steps involved in it
1 Expert Approved Answer
Step: 1 Unlock

A plot is given in Figure 103 Figure 103 Proba... View full answer
Question Has Been Solved by an Expert!
Get step-by-step solutions from verified subject matter experts
Step: 2 Unlock
Step: 3 Unlock