

Question: Use MATLAB to plot curves of P b versus E b / N 0 , M = 2, 4, 8, 16, and 32, for (a)
Use MATLAB to plot curves of Pbversus Eb/ N0, M = 2, 4, 8, 16, and 32, for
(a) M-ary coherent FSK (use the upper-bound expression as an approximation to the actual error probability)
(b) M-ary non-coherent FSK Compare your results with Figures 10.15(a) and (b).
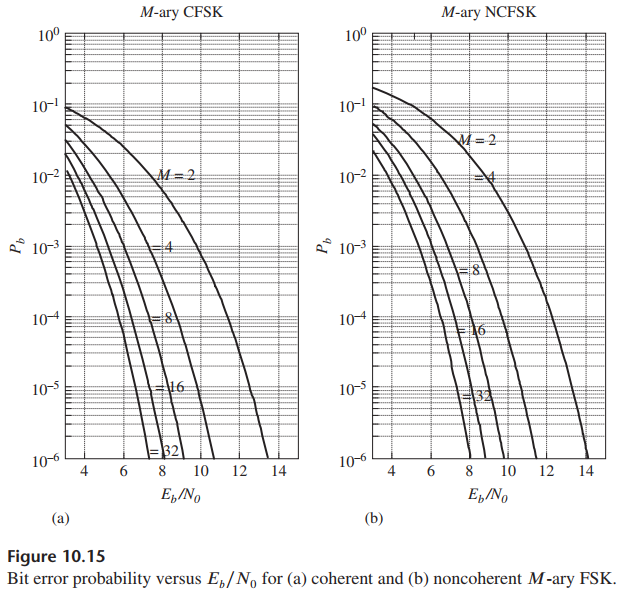
M-ary CFSK M-ary NCFSK 100 100 10- 10- M=2 10-2 10-2 e 10-3 e 10-3 104 104 10-5 16 10-5 31 32 10-6 4 10-6 4 6 8 10 12 14 8 10 6 12 14 E,/No E,/No (b) Figure 10.15 Bit error probability versus E,/N, for (a) coherent and (b) noncoherent M-ary FSK.
Step by Step Solution
3.38 Rating (167 Votes )
There are 3 Steps involved in it
clf zdB 3115 z 10zdB10 for j 15 M2j A M2M1 if j 1 Pbc qfnsqrtz elseif ... View full answer

Get step-by-step solutions from verified subject matter experts