

A Fortune 500 company is tracking revenues versus cash flow for recent years, and the data is
Question:
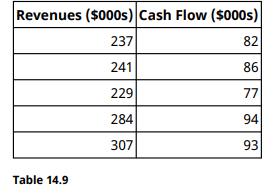
A Fortune 500 company is tracking revenues versus cash flow for recent years, and the data is shown in the table below. Consider cash flow to be the dependent variable. Create a scatter plot of the data set, comment on the correlation between these two variables, and comment on the correlation for this data (all dollar amounts are in thousands).
Fantastic news! We've Found the answer you've been seeking!
Step by Step Answer:
A scatter plot of the data would show a positive correlation betwe...View the full answer

Answered By
BillClinton Muguai
I have been a tutor for the past 5 years. I have experience working with students in a variety of subject areas, including computer science, math, science, English, and history. I have also worked with students of all ages, from elementary school to college. In addition to my tutoring experience, I have a degree in education from a top university. This has given me a strong foundation in child development and learning theories, which I use to inform my tutoring practices.
I am patient and adaptable, and I work to create a positive and supportive learning environment for my students. I believe that all students have the ability to succeed, and it is my job to help them find and develop their strengths. I am confident in my ability to tutor students and help them achieve their academic goals.
0 Reviews
10+ Question Solved
Related Book For 

Question Posted:
