

In the Baltimore housing data motion chart, go to the bar chart tab and set the y
Question:
In the Baltimore housing data motion chart, go to the bar chart tab and set the y axis to “Median Price of Homes Sold” (leave the x axis on “Order: Median Price of Homes Sold”).
 a) In 2005, what was the “Median Price of Homes Sold” for Greater Roland Park/Poplar Hill?
b) In 2014, what was the “Median Price of Homes Sold” for Greater Roland Park/Poplar Hill?
Fantastic news! We've Found the answer you've been seeking!
Step by Step Answer:
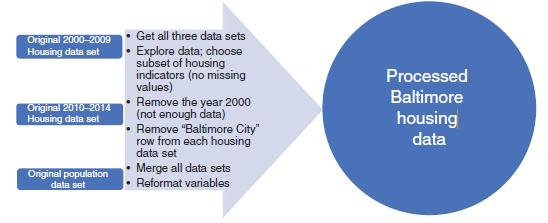
Explore Data and Choose Subset of Housing Indicators no missing values In this step you would examin...View the full answer

Answered By
Akash M Rathod
I have been utilized by educators and students alike to provide individualized assistance with everything from grammar and vocabulary to complex problem-solving in various academic subjects. I can provide explanations, examples, and practice exercises tailored to each student's individual needs, helping them to grasp difficult concepts and improve their skills.
My tutoring sessions are interactive and engaging, utilizing a variety of tools and resources to keep learners motivated and focused. Whether a student needs help with homework, test preparation, or simply wants to improve their skills in a particular subject area, I am equipped to provide the support and guidance they need to succeed.
0 Reviews
10+ Question Solved
Related Book For 

Principles Of Managerial Statistics And Data Science
ISBN: 9781119486411
1st Edition
Authors: Roberto Rivera
Question Posted:
