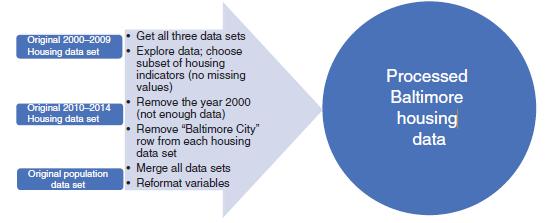
Returning to the Baltimore housing data motion chart. Set the x axis to % of Residential Properties
Question:
Returning to the Baltimore housing data motion chart. Set the x axis to “% of Residential Properties Vacant” and the y axis to “% of Properties Under Mortgage Foreclosure.” What part of the design of the motion chart makes it difficult to use the chart to visualize the association between the two housing variables?

Fantastic news! We've Found the answer you've been seeking!
Step by Step Answer:
Related Book For 

Principles Of Managerial Statistics And Data Science
ISBN: 9781119486411
1st Edition
Authors: Roberto Rivera
Question Posted:


