

Question: Unit step response data are given in Table E7.15 for a process with gain K = 2. Fit the data to a first order model
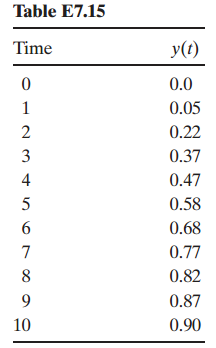
Table E7.15 Time y(t) 0.0 0.05 0.22 3 0.37 0.47 4 0.58 0.68 0.77 0.82 9. 0.87 10 0.90
Step by Step Solution
★★★★★
3.51 Rating (148 Votes )
There are 3 Steps involved in it
1 Expert Approved Answer
Step: 1 Unlock

a FOPTD model Since K 1 using linear interpolation to find times correspondin... View full answer
Question Has Been Solved by an Expert!
Get step-by-step solutions from verified subject matter experts
Step: 2 Unlock
Step: 3 Unlock
Document Format (2 attachments)
1602_606321ef168e9_680103.pdf
180 KBs PDF File
1602_606321ef168e9_680103.docx
120 KBs Word File