

Question: The following data were collected from a cell concentration sensor measuring absorbance in a biochemical stream. The input u is the flow rate deviation (in
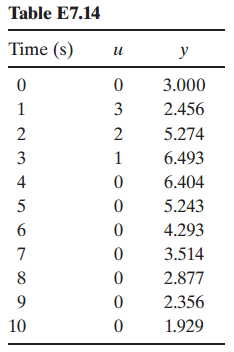
Fit a first order model, y(k) = a1y(kˆ’1) + b1 u(kˆ’1), to the data using the least-squares approach. Plot the model response and the actual data. Can you also find a first-order continuous transfer function G(s) to fit the data?
Table E7.14 Time (s) y 3.000 3 2.456 2 5.274 3 6.493 4 6.404 5 5.243 6. 4.293 3.514 2.877 2.356 10 1.929 1,
Step by Step Solution
★★★★★
3.24 Rating (156 Votes )
There are 3 Steps involved in it
1 Expert Approved Answer
Step: 1 Unlock

To find a 1 and b 1 use the given first order model to m... View full answer
Question Has Been Solved by an Expert!
Get step-by-step solutions from verified subject matter experts
Step: 2 Unlock
Step: 3 Unlock