

Question: Using the data for Exercise 13.36, add the resource assignments to each of the activities and input their hourly rates as shown. Construct an earned
Using the data for Exercise 13.36, add the resource assignments to each of the activities and input their hourly rates as shown.
Construct an earned value chart for the project. Which activities have negative variances? What is the estimate at completion
(EAC) for the project? (Hint: Remember to click “Set baseline”
prior to creating the EVM table. This table is found by clicking on the “View” tab, then “Tables,” then “Other Tables.”)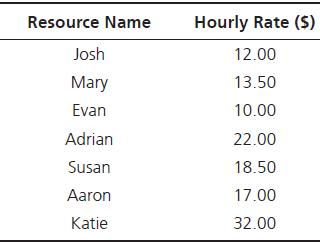
Exercise 13.36
Use the following information to construct a Gantt chart in MS Project. What is the expected duration of the project (critical path)? Assume the project is halfway finished in terms of the schedule (day 16 completed) but activity completion percentages are as shown. Construct a tracking Gantt chart for the project (be sure to show the percentage complete for each activity).
What would it look like?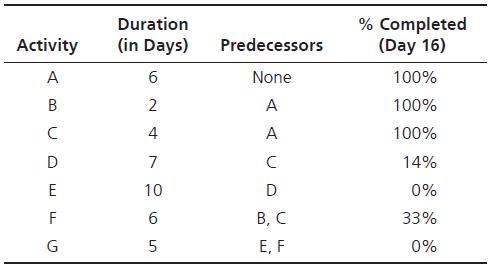
Resource Name Hourly Rate ($) Josh 12.00 Mary 13.50 Evan 10.00 Adrian 22.00 Susan 18.50 Aaron 17.00 Katie 32.00
Step by Step Solution
3.51 Rating (154 Votes )
There are 3 Steps involved in it

Get step-by-step solutions from verified subject matter experts