

Question: For the data presented in problem 14 draw an earned value chart similar to the one presented in Figure 11-5. Duration Activity Predecessors (Weeks) Budget
For the data presented in problem 14 draw an earned value chart similar to the one presented in Figure 11-5.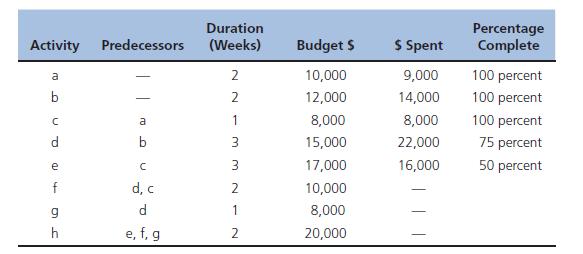
Duration Activity Predecessors (Weeks) Budget $ $ Spent Percentage Complete a b 2 10,000 9,000 100 percent 2 - 12,000 14,000 100 percent C a 1 8,000 8,000 100 percent d b 3 15,000 22,000 75 percent e C 3 17,000 16,000 50 percent f d, c 2 10,000 g d 1 8,000 h e, f, g 2 20,000
Step by Step Solution
There are 3 Steps involved in it
1 Expert Approved Answer
Step: 1 Unlock

Question Has Been Solved by an Expert!
Get step-by-step solutions from verified subject matter experts
Step: 2 Unlock
Step: 3 Unlock