

Question: Does this example support the risk event graph (Figure 7.1)? Explain. Risk High Low Chances of risks occurring Defining Planning Executing Project Life Cycle Cost
Does this example support the risk event graph (Figure 7.1)? Explain.
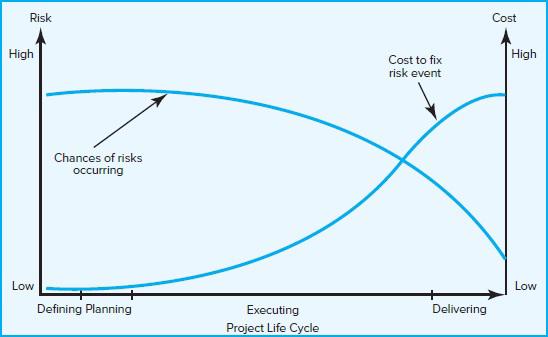
Risk High Low Chances of risks occurring Defining Planning Executing Project Life Cycle Cost to fix risk event Delivering Cost High Low
Step by Step Solution
★★★★★
3.45 Rating (161 Votes )
There are 3 Steps involved in it
1 Expert Approved Answer
Step: 1 Unlock

According to Giant Popsicle Gone Wrong the danger of the project going over budget grows as the time ... View full answer
Question Has Been Solved by an Expert!
Get step-by-step solutions from verified subject matter experts
Step: 2 Unlock
Step: 3 Unlock