

Question: Using the status chart in Figure 11-20: a. Estimate AV, SV, CV, and TV, and compute SPI and CPI for Week 30. Interpret the results.
Using the status chart in Figure 11-20:
a. Estimate AV, SV, CV, and TV, and compute SPI and CPI for Week 30.
Interpret the results.
b. Compute ETC and EAC. Estimate the revised completion date and sketch the lines for forecast ACWP and forecast BCWP.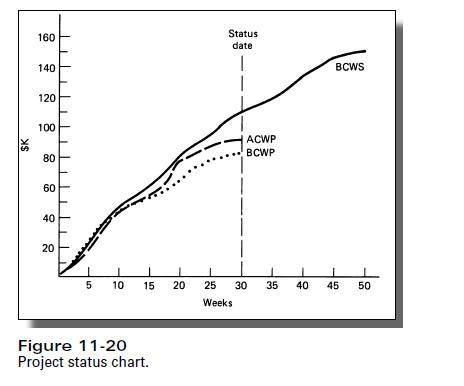
160 $K 140 20 120 T 100 100 80 80 60 60 40 40 20 20 Status date T BCWS ACWP BCWP 1 5 10 15 20 25 30 35 Weeks Figure 11-20 Project status chart. 40 45 50
Step by Step Solution
There are 3 Steps involved in it
1 Expert Approved Answer
Step: 1 Unlock

Question Has Been Solved by an Expert!
Get step-by-step solutions from verified subject matter experts
Step: 2 Unlock
Step: 3 Unlock