

Question: 17. Determine the PTPC chart plot point for the following: USL LSL Nominal Part 1 Part 2 (a) 0.460 0.440 0.450 0.449 0.458 (b) 1.505
17. Determine the PTPC chart plot point for the following:
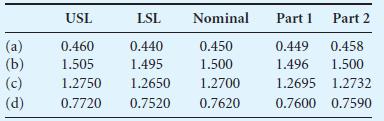
USL LSL Nominal Part 1 Part 2 (a) 0.460 0.440 0.450 0.449 0.458 (b) 1.505 1.495 1.500 1.496 1.500 (c) 1.2750 1.2650 1.2700 1.2695 1.2732 (d) 0.7720 0.7520 0.7620 0.7600 0.7590
Step by Step Solution
There are 3 Steps involved in it
1 Expert Approved Answer
Step: 1 Unlock

Question Has Been Solved by an Expert!
Get step-by-step solutions from verified subject matter experts
Step: 2 Unlock
Step: 3 Unlock