

Question: 2. Determine the trial central line and control limits for a p chart using the following data, which are for the payment of dental insurance
2. Determine the trial central line and control limits for a p chart using the following data, which are for the payment of dental insurance claims. Plot the values on graph paper and determine if the process is stable. If there are any out-of-control points, assume an assignable cause and determine the revised central line and control limits.
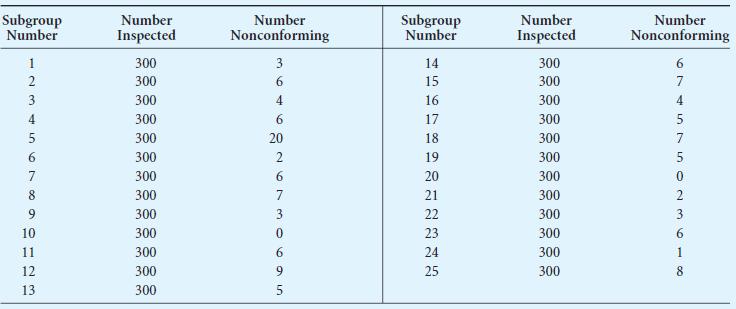
Subgroup Number Number Inspected Number Nonconforming Subgroup Number Number Inspected Number Nonconforming 1 300 3 14 300 234567890123 300 300 300 300 300 300 300 300 300 11 300 300 300 646926730695 15 300 16 300 17 300 18 300 19 300 20 300 21 300 22 300 23 300 24 300 25 674575023618 300
Step by Step Solution
There are 3 Steps involved in it

Get step-by-step solutions from verified subject matter experts