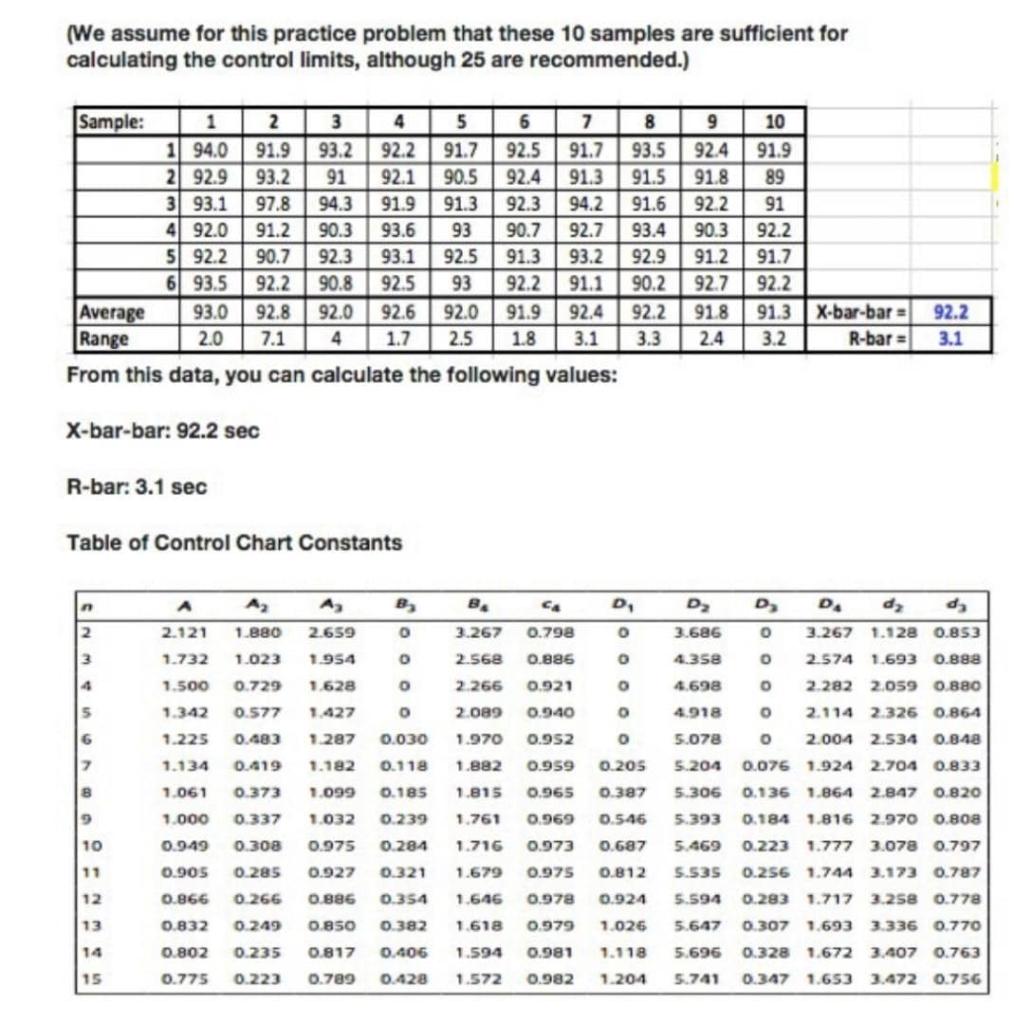
Question: INDUSTRIAL QUALITY CONTROL SUBJECT (We assume for this practice problem that these 10 samples are sufficient for calculating the control limits, although 25 are recommended.)

INDUSTRIAL QUALITY CONTROL SUBJECT (We assume forINDUSTRIAL QUALITY CONTROL SUBJECT

INDUSTRIAL QUALITY CONTROL SUBJECT (We assume for

(We assume for this practice problem that these 10 samples are sufficient for calculating the control limits, although 25 are recommended.) 9 L 92.4 1 D ISIT | Sample: 1 2 3 4 5 6 7 1/ 94.0 91.9 93.2 92.2 91.7 92.5 91.7 2 92.9 93.2 91 92.1 90.5 91.3 3/ 93.1 97.8 94.3 91.9 91.3 92.3 94.2 41 92.0 91.2 90.3 93.6 93 90.7 92.7 5 92.2 90.7 92.3 93.1 92.5 91.3 93.2 6| 93.5 92.2 90.8 92.5 93 92.2 91.1 Average 93.0 92.8 92.0 92.6 92.0 91.9 92.4 Range 2.0 7.1 4 1.7 2.5 1.8 3.1 From this data, you can calculate the following values: 8 93.5 91.5 91.6 93.4 92.9 90.2 92.2 3.3 92.4 91.8 922 90.3 91.2 92.7 91.8 2.4 10 91.9 89 91 92.2 91.7 92.2 91.3 3.2 X-bar-bar = R-bar = 92.2 3.1 X-bar-bar: 92.2 sec R-bar: 3.1 sec Table of Control Chart Constants n A 8 B CA D D D A 1.880 2. 2.659 O 3.267 0.798 O 3.686 A 2.121 1.732 1.500 OOO dy d 3.267 1.128 0.853 2.574 1.693 0.888 3 1.023 1.954 O 2.568 O 4.358 0.886 0.921 4 0.729 1.628 O 2.266 O 4.698 O 2.282 2.059 0.880 5 0.577 1.427 O 2.089 O 0 2.114 2326 0.864 1.342 1.225 1.134 0.940 0.952 6 0.483 1.287 0.030 1.970 O O 2.004 2.534 0.848 7 0.419 1.182 0.118 1.882 0.959 0.205 4.918 5.078 5.204 5.306 5.393 0.076 1.924 2.704 0.833 8 0.373 1.099 0.185 1.815 0.965 0.387 9 0.337 1.032 0.239 1.761 0.969 0.546 1.061 1.000 0.949 0.905 10 0.308 0.975 0.284 1.716 0.973 0.687 5.469 11 0.285 0.927 0.321 1.679 0.975 0.812 5.535 0.136 1.864 2.847 0.820 0.184 1.816 2.970 0.808 0.223 1.777 3.078 0.797 0.256 1.744 3.173 0.787 0.283 1.717 3.258 0.77a 0.307 1.693 3.336 0.770 0.328 1.672 3.407 0.763 0.347 1.653 3.472 0.756 12 0.866 0.266 0886 0.354 1.646 0.978 0.924 5.594 13 0.832 0.249 1.618 0.979 5.647 0.850 0.817 0.382 0.406 1.026 1.118 14 0.802 0.235 1.594 0.981 5.696 15 0.775 0.223 0.789 0.428 1.572 0.982 1.204 5.741 Data as shown in Table 3 is a preliminary data of computer modem during final test. Table 3 Month Subgroup Fraction non- conforming UCL LCL 0.024 0.024 0.017 0.013 0.043 0.029 0.030 0.030 0.029 0.032 0.011 0.010 0.010 0.011 0.008 Number inspected 10218 2168 1941 1962 2244 1238 9831 2354 1509 2190 2678 7668 2382 2132 2 4 6 8 10 12 14 16 18 20 22 24 26 28 Number non- conforming 204 52 47 34 29 53 183 38 28 30 113 141 17 46 March 0.016 0.018 0.014 0.042 0.029 0.031 0.029 0.028 0.011 0.009 0.011 0.012 0.007 0.022 0.029 0.029 0.011 0.011 (a) Determine the trial central line and control limits on 2nd, 14th and 24th March. (b) (C) Develop a control chart for data collected on March. Determine the revise central line for April. By considering the reference value of fraction non-conforming, po with specifications are 0.050 and 0.005, analyze the capability index with condition of waste generation. (d)

Step by Step Solution

There are 3 Steps involved in it

1 Expert Approved Answer
Step: 1 Unlock blur-text-image
Question Has Been Solved by an Expert!

Get step-by-step solutions from verified subject matter experts

Step: 2 Unlock
Step: 3 Unlock

Students Have Also Explored These Related General Management Questions!