Question: Q2 only Control Charts for Attributes EXERCISES c. If it is assumed that any out-of-control points have assignable causes, what central line and control limits

Q2 only Q2 only Control Charts for Attributes EXERCISES
Control Charts for Attributes EXERCISES c. If it is assumed that any out-of-control points have assignable causes, what central line and control limits should be used for the next period? 1. On the next page is a typical attribute chart form with 2. Determine the trial central line and control limits for a a. Calculate the proportion nonconforming for subp chart using the following data, which are for the paygroups 21,22,23,24, and 25. Construct a run ment of dental insurance claims. Plot the values on graph chart. paper and determine if the process is stable. If there are b. Calculate the trial central line and control limits. any out-of-control points, assume an assignable cause Draw these values on the chart. and determine the revised central line and control limits

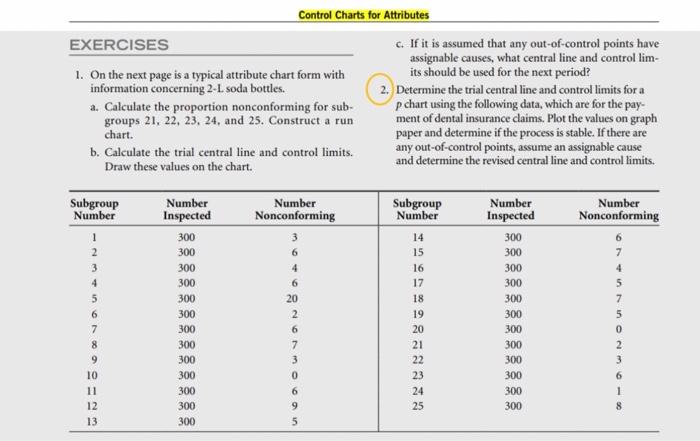
Step by Step Solution

There are 3 Steps involved in it

1 Expert Approved Answer
Step: 1 Unlock blur-text-image
Question Has Been Solved by an Expert!

Get step-by-step solutions from verified subject matter experts

Step: 2 Unlock
Step: 3 Unlock

Students Have Also Explored These Related General Management Questions!