

(a) The linear calibration curve in Figure 4-13 is y 5 0.016 30 (0.000 22) x 1...
Question:
(a) The linear calibration curve in Figure 4-13 is y 5 0.016 30 (±0.000 22) x 1 0.0047 (±0.0026) with sy = 0.0059. Find the quantity of unknown protein that gives a measured absorbance of 0.264 when a blank has an absorbance of 0.095.
(b) Figure 4-13 has n = 14 calibration points in the linear portion. You measure k = 4 replicate samples of unknown and find a mean corrected absorbance of 0.169. Find the standard uncertainty
and 95% confi dence interval for protein in the unknown.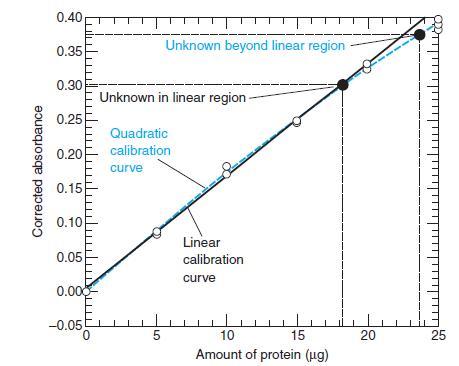
Fantastic news! We've Found the answer you've been seeking!
Step by Step Answer:
We are given a Ans Measured absorbance 0264 Blank absor...View the full answer

Answered By
Simar Singh
I have an experience of two years of tutoring in my area. My expertise subjects are Economics, English, Accountancy, Business studies, Financial accountancy.
0 Reviews
10+ Question Solved
Related Book For 
Question Posted:
