Figure 5-10 is a graph of AX/AS versus [X]/[S] 5 (mol% vinyl acetate units)/(mol% ethylene units) 5
Question:
Figure 5-10 is a graph of AX/AS versus [X]/[S] 5 (mol% vinyl acetate units)/(mol% ethylene units) 5 q/p in Reaction 5- 13.
In figure 5-10
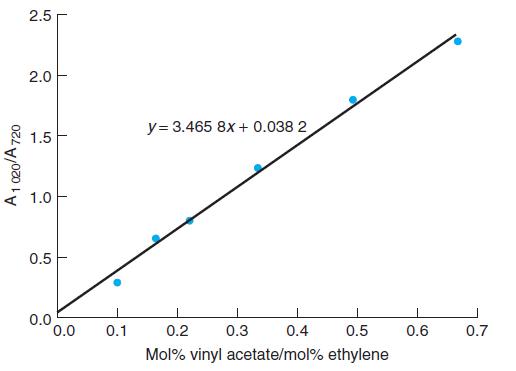
(a) Construct the graph in Figure 5-10 from the following data: 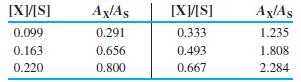
(b) Use a least-squares spreadsheet such as that in Figure 4-15 to find the slope and intercept and uncertainties sy, um, and ub of the calibration line in (a).
(c) From the equation of the line, find [X]/[S] for a measured value AX/AS 5 1.98. Use Equation 4-27 in your spreadsheet to fi nd the standard uncertainty ux in the quotient [X]/[S]. The graph has 6 points with 4 degrees of freedom. Find the 95% confidence interval (5 6tux) for [X]/[S].
(d) From the uncertainty ub of the intercept, find the 95% confidence interval for the intercept. Does this interval include the theoretical value of zero?
Step by Step Answer:

This question has not been answered yet.
You can Ask your question!