

Question: Repeat Problem 4-6 but use the values 50, 100, and 150 for the standard deviation. Superimpose all three curves on a single graph. Problem 4-6
Repeat Problem 4-6 but use the values 50, 100, and 150 for the standard deviation. Superimpose all three curves on a single graph.
Problem 4-6
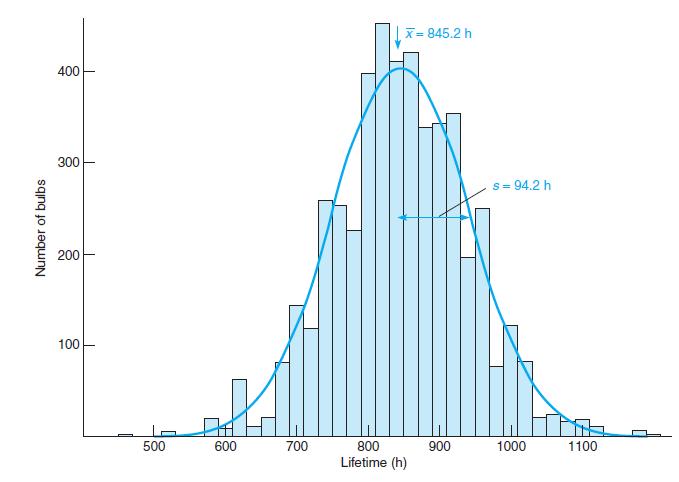
The equation for the Gaussian curve in Figure 4-1 is
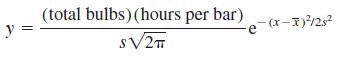
where x̅ is the mean value (845.2 h), s is the standard deviation (94.2 h), total bulbs = 4 768, and hours per bar (= 20) is the width of each bar in Figure 4-1. Set up a spreadsheet like the one on the next page to calculate the coordinates of the Gaussian curve in Figure 4-1 from 500 to 1 200 h in 25-h intervals. Note the heavy use of parentheses in the formula at the bottom of the spreadsheet to force the computer to do the arithmetic as intended. Use Excel to graph your results.
Figure 4-1
(total bulbs) (hours per bar) y =
Step by Step Solution
3.50 Rating (160 Votes )
There are 3 Steps involved in it
The Gaussian curve formula for this problem is given as y tot... View full answer

Get step-by-step solutions from verified subject matter experts