

The equation for the Gaussian curve in Figure 4-1 is where x is the mean value (845.2
Question:
The equation for the Gaussian curve in Figure 4-1 is
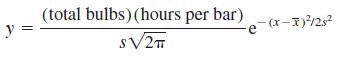
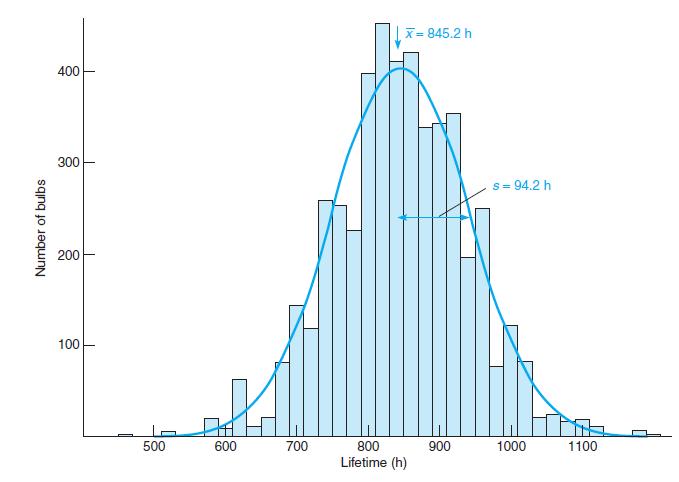
where x̅ is the mean value (845.2 h), s is the standard deviation (94.2 h), total bulbs = 4 768, and hours per bar (= 20) is the width of each bar in Figure 4-1. Set up a spreadsheet like the one on the next page to calculate the coordinates of the Gaussian curve in Figure 4-1 from 500 to 1 200 h in 25-h intervals. Note the heavy use of parentheses in the formula at the bottom of the spreadsheet to force the computer to do the arithmetic as intended. Use Excel to graph your results.
Figure 4-1
Fantastic news! We've Found the answer you've been seeking!
Step by Step Answer:
To set up a spreadsheet you can create a column for the xaxis values ...View the full answer

Answered By
Dulal Roy
As a tutor, I have gained extensive hands-on experience working with students one-on-one and in small group settings. I have developed the ability to effectively assess my students' strengths and weaknesses, and to customize my teaching approach to meet their individual needs.
I am proficient at breaking down complex concepts into simpler, more digestible pieces, and at using a variety of teaching methods (such as visual aids, examples, and interactive exercises) to engage my students and help them understand and retain the material.
I have also gained a lot of experience in providing feedback and guidance to my students, helping them to develop their problem-solving skills and to become more independent learners. Overall, my hands-on experience as a tutor has given me a deep understanding of how to effectively support and encourage students in their learning journey.
0 Reviews
10+ Question Solved
Related Book For 

Question Posted:
