

Question: Simulating a separation with a spreadsheet. Use the spreadsheet in Figure 25-39 to simulate the chromatograms for =0.75= 0.75 and =0.56= 0.56 in Figure 25-40.
Simulating a separation with a spreadsheet. Use the spreadsheet in Figure 25-39 to simulate the chromatograms for Ф=0.75Ф= 0.75 and Ф=0.56Ф= 0.56 in Figure 25-40.
Figure 25-39
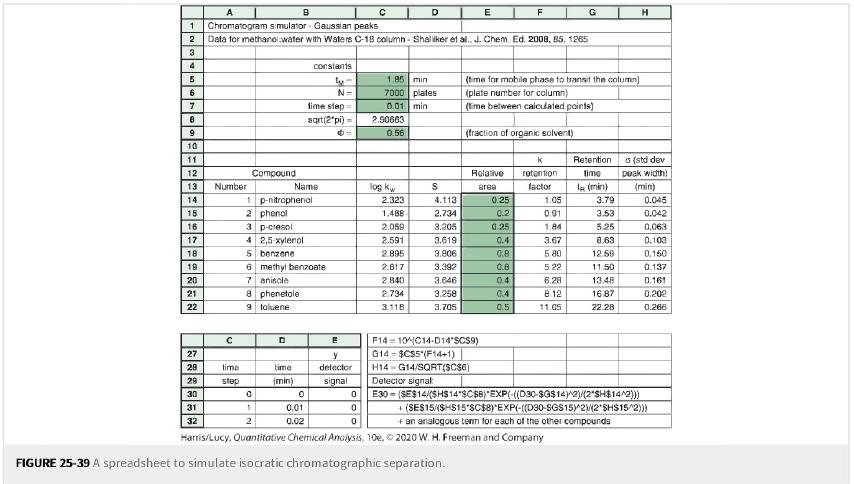
Figure 25-40

A 1 Chromatogram simulator Gaussian peaks 2 Data for methanol water with Waters C-18 column-Shaliker et al., J. Chem. Ed. 2008, 85, 1265 3 4 5 6 7 8 9 10 11 12 13 14 15 16 17 18 19 20 21 22 328*** Number time step Compound B 1 p-nitrophenol 2 phenol 8 phenetole 9 toluene 0 1 2 3 p-cresol 4 2,5-xylenol 5 benzene 6 methyl benzoate 7 aniscle D Name time (min) constants ly- N= time step= sqrt(2*pi)= 0 0.01 0.02 E y detector signal 0 0 1.85 min 7000 plates 0.01 min 2.50663 0.56 log kw D 2.323 1.488 2.059 2.591 2.895 2.817 2,840 2.734 3.118 S 4.113 2.734 3.206 3.619 3,806 3.392 3.646 3,258 3.705 E 0 Hanis/Lucy, Quantitative Chemical Analysis, 10e, FIGURE 25-39 A spreadsheet to simulate isocratic chromatographic separation. F14104C14-D14"SCS9) G14 $CS5 (F14+1) H14 G14/SQRT($C$6) Detector signal (time for mobile phase to transit the column) (plate number for column) (time between calculated points) (fraction of organic solvent) Relative area 0.25 0.2 F 0.25 0.4 0.8 0.8 0.4 0.4 0.5 88 K retention: factor 1.05 0.91 1.84 G 3.67 5.80 5.22 6.28 8.12 11.05 Retention time 1 (min) 3.79 3.53 5.25 8.63 12.59 11.50 13.48 16.87 22.28 H (std dev peak width) (min) 0.045 0.042 0.063 0.103 0.150 0.137 0.161 0.202 0.266 E30-($E$14/(SH$14*$C$8) EXP(-((D30-$G$14)^2)/(2*SH$14^2))) +(SES15/(SHS15 SC$8)*EXP(-((D30-SGS15)^2(2 SHS15^2))) + an analogous term for each of the other compounds 2020 W. H. Freeman and Company
Step by Step Solution
3.57 Rating (164 Votes )
There are 3 Steps involved in it
To simulate a separation with a spreadsheet you would need to create a table with the relevant param... View full answer

Get step-by-step solutions from verified subject matter experts